PCG Overview
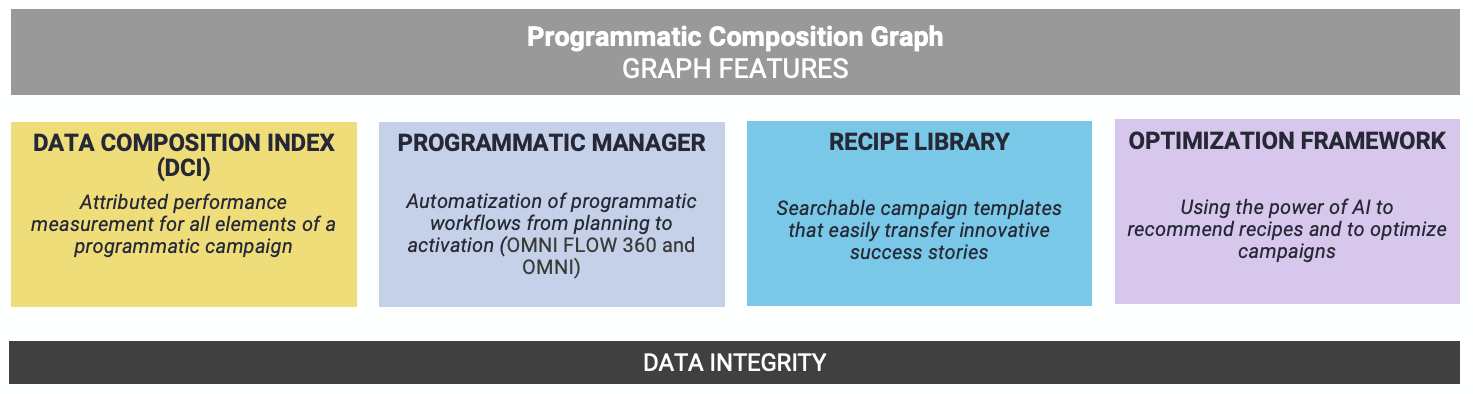
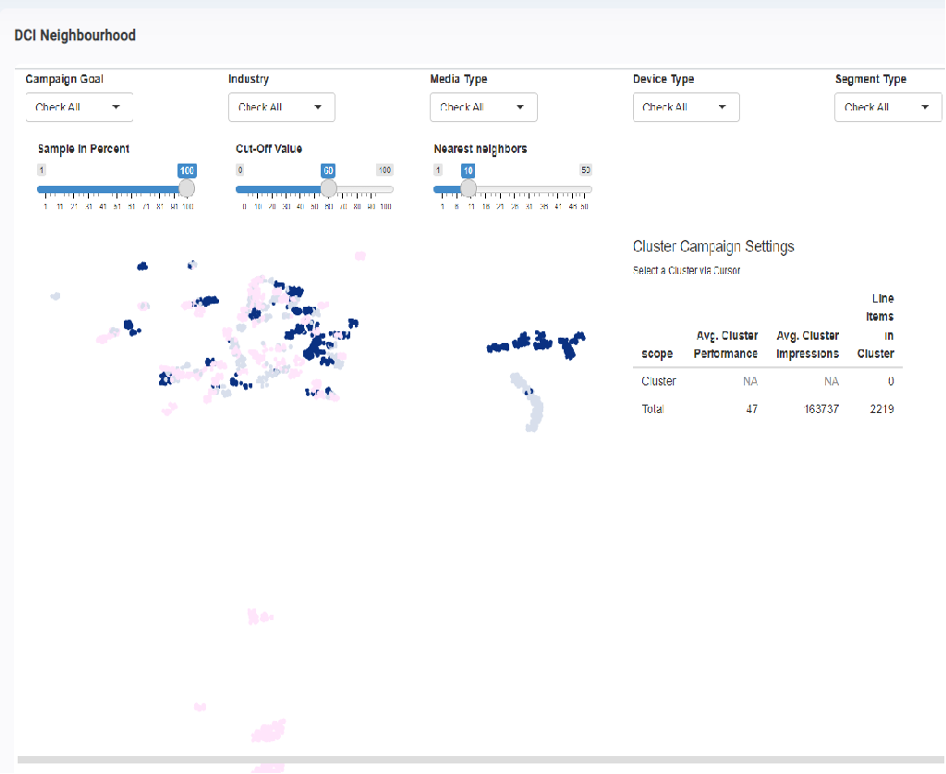
To understand the Performance Index we first give an overview of how the PCG is structured and that the DCI Dashboard is a component of the Data Composition Index (DCI) Core Element.
DCI Breakdown
The DCI allows the de-composition of campaign performances to understand how well a campaign performed and what the major drivers of this performance along the defined recipe-dimensions are.Therefore the DCI should act as a simple, easy to understand campaign KPI across all forms of media that accurately reflects performance relative to well-defined benchmark criteria.DCI should enable easier decisions e.g. between data providers or DSP settings as well as enable other graph features such as recipe benchmarks or optimisation via the Performance Index.

The DCI consists of 4 components that are calculated sequentially

Performance Index Calculation
To calculate the Index, we look first at the campaign goals for each campaign across our network which are matched and then standardised across a logical set of benchmark groups
After the standardisation process, a model is incorporated to predict performance using recipe dimensions as predictors.
Finally, the model balances are scaled from 0-100 and used as the final index score.
This can be seen below in more detail below:
Standardised Outcomes
First we need to make CpM / CpV / etc. campaigns comparable
Open Decisions:
- Multi-dimensional / weighted target vs. singular mapped target
- Relevant target map
Determining the target KPI
| Insertion Order Goal | Campaign KPI |
| CPM | CPM |
| CtR | CtR |
| CpV | CpV |
| Other | CPM |
Scaling KPIs
The assigned target KPI of each campaign is first standardised using a robust scalar to remove outlier bias and scale all KPIs to the same dimension.
In a second step they are then rescaled from 0-100 for ease of interpretation. All values that are outside of 1 SD of the median values are automatically scaled to the extremes to reflect extreme under- / over performance.
Open Decisions:
- Best scaling approach
- Re-scaling before modelling necessary?
- Standard Deviation range of cutting of re-scaling or alternative outlier treatment
Example:
| Campaign KPI | Scaled Raw Score |
| 5€ CPM | 50 |
| 25% CTR | 60 |
| 0,02€ CPV | 55 |
| 7€ CPM | 30 |
Mapping Campaign Composition
We map all relevant performance drivers to a simplified campaign composition Segment data as well as DSP Settings are projection mapped to reduce complexity and bring categorical and semantic values to the same mathematical level.
UMAP projection is used to reduce campaign recipes to a two-dimensional vector trained on 2022 data, producing spatial similarity between campaigns that share a lot of settings.
This allows computationally efficient searches and benchmarks as well as more intuitive visualisations.
Open Decisions:
- Embedding and projection vs. different model approaches
- DB-based Graphing vs. KNN Networks
- Pre-Selection of relevant dimensions and feature engineering vs. open, raw data approach

Modelling Performance Attribution
Using an attribution approach we model the performance and score residualsUsing the UMAP benchmark criteria we build a predictive model for the raw performance scores.
The residuals (delta prediction vs. truth) are then taken and scaled to a 0-100 final performance score.
Therefore, the performance score reflects the performance relative to the benchmark set and not an absolute performance.
Open Decisions:
- Benchmark group vs. benchmark predictors
- Tightness of benchmarks determines relativity of performance
- Absolute target elements