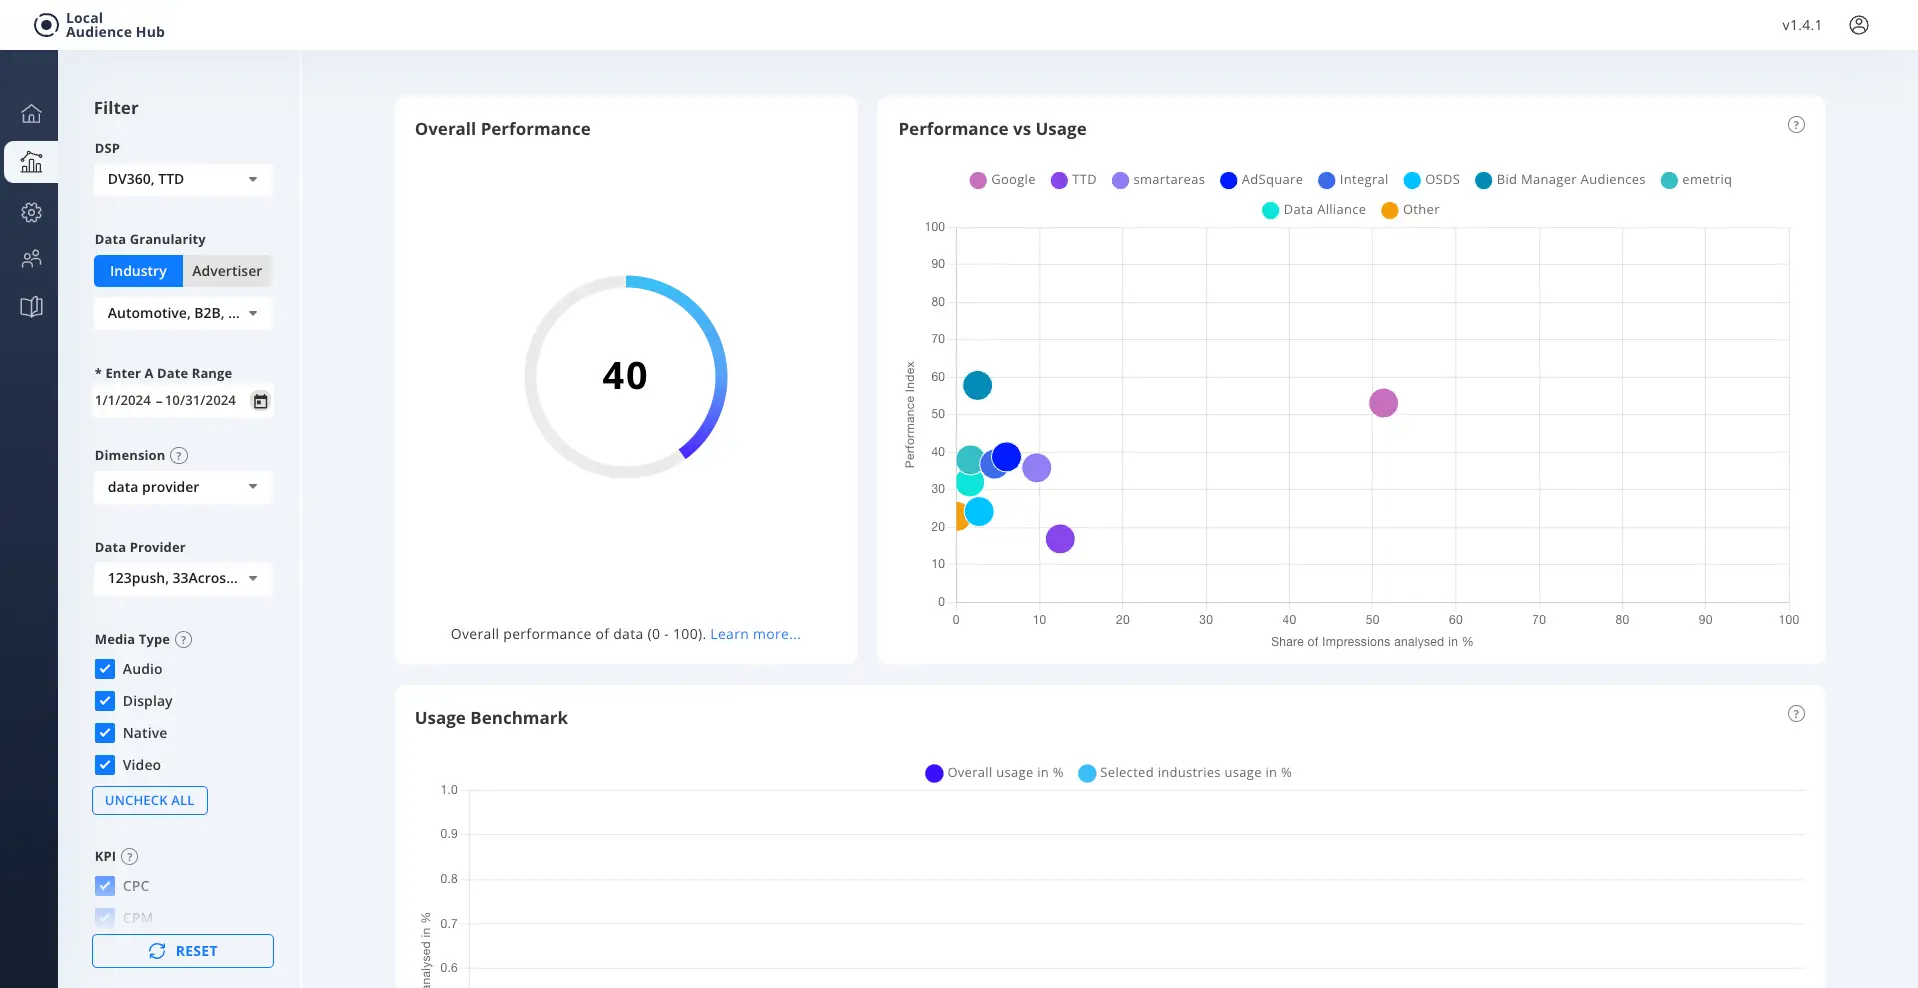
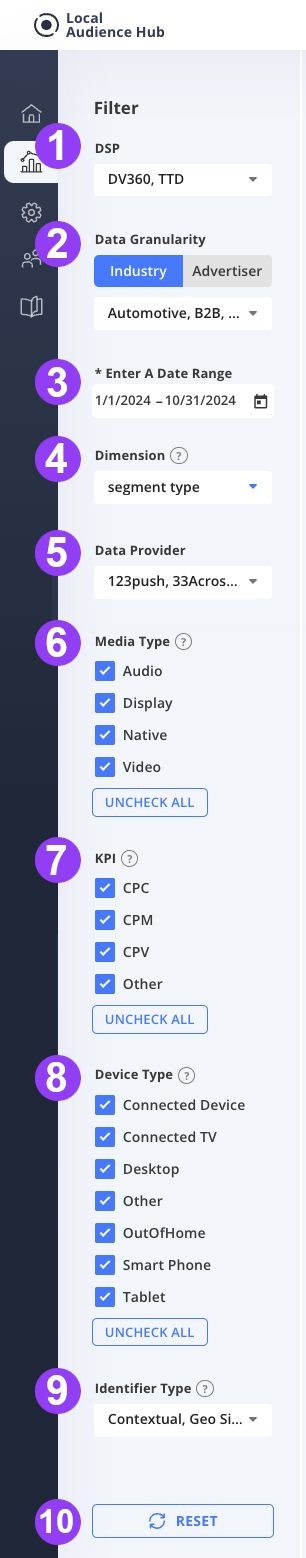
Programmatic Targeting Insights General Help

DCI Dashboard default view

The Programmatic Targeting Insights dashboard consists of four main elements explained as follows:

1. Left side Filter Panel

    1. DSP

    The DSP (Demand Side Platform) filter allows a user to choose data from a particular platform. There are currently two platforms available:

    • DV360 (Google Display & Video 360)
    • TTD (The Trade Desk).

    Both are selected as default.

    1. Data Granularity

    The Data Granularity toggle allows the user to choose whether they would like to see data represented into an industry split or a client split, the user can then further filter to a specific industry or client of their choice.

    Please note the availability of clients here is based on a user’s access in each relevant DSP, if a client cannot be seen first confirm you have the correct permissions with the DSP.

    1. Enter A Date Range *

    A data range selector is available with the filters, this allows a user to currently choose the months for which they would like to view data.

    Choosing a date within a month will choose the full data for that monthly period.
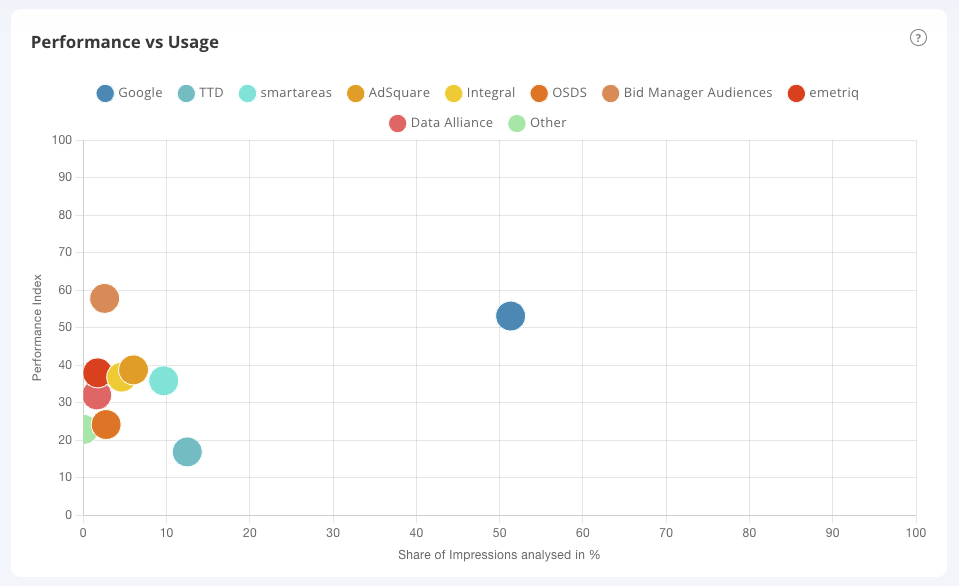
    1. Dimension

    The dimension shows the way in which data in the dashboard can be split, choosing one will change the data representation but also the X & Y axis in the Dimension based Scatter Graph.

    The following dimensions are available:

    • Data Provider
    • Data Type
    • Match Method
    • Data Provider Type
    • Identifier Type
    • Segment Type
    • Future-proof

    Data Provider is selected as default.
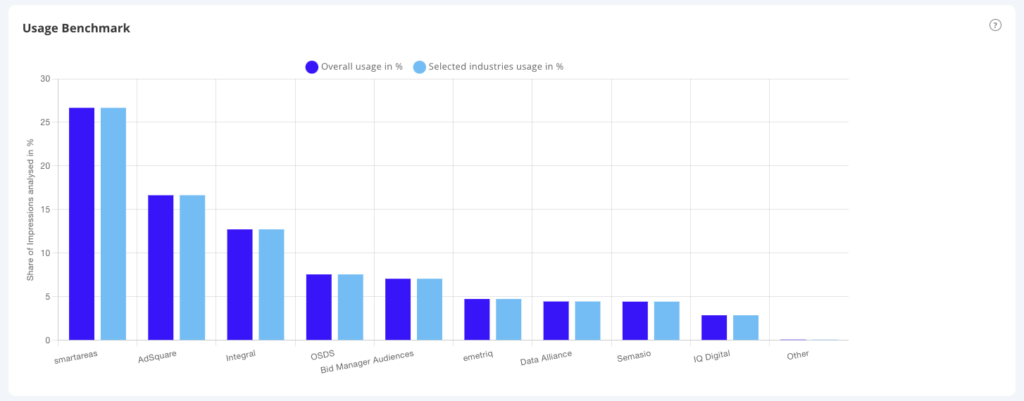
    1. Data Provider

    Here a user can filter on a specific Data Provider, Only data providers within the PCG data are available, if a provider is not available this means usage is 0.
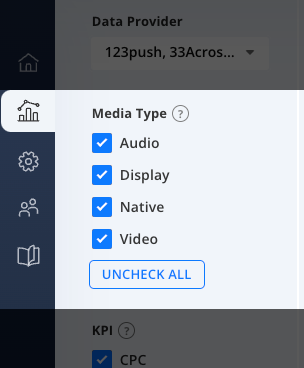
    1. Media Type

    Media Type offers check boxes to choose which type of media usage is to be reviewed, it is currently split by:
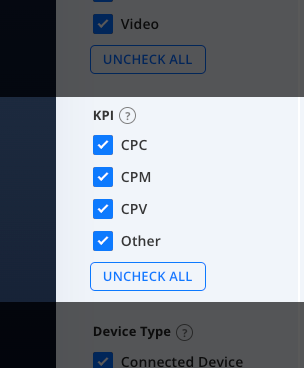
    • Audio
    • Display
    • Video

    1. KPI

    KPI offers check boxes to choose which KPI is utilised at the overall campaign level, it is currently split by:
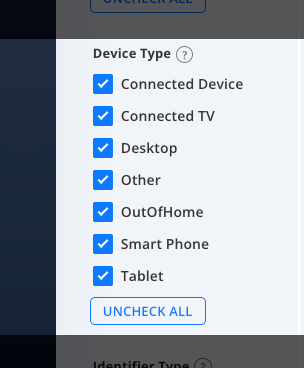
    • CPC
    • CPM
    • CPV
    • Other

    1. Device Type

    Device Type show the device on two which the final advertisement was rendered/played, it is currently split by:

    • Connected Device
    • Connected TV
    • Desktop
    • Other
    • OutOfHome
    • Smart Phone
    • Tablet

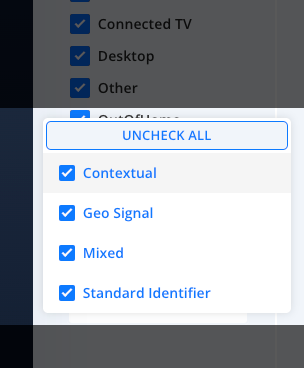
    1. Filter Identifier Type 1 (Identifier Type)

    This filter allows a user to show the data split on the Identifier that was in use, it is currently split by:

    • Contextual
    • Geo Signal
    • Mixed
    • Standard Identifier

    1. RESET

    The reset button will clear any changes made to filters and return filters to their defaults.

DCI Menu

2. Overall Performance Index Score

Performance Index
Overall Performance Index Score

The Overall Performance element show us the Performance Index Score of your chosen filtered Data, the score is based on a 0 – 100 scale and priority to Annalect PCG.

3. Dimension based Scatter Graph

The Dimension based Scatter Graph changes based on your choice of dimension.

It has two axis and a legend at the top to denote markers.

y axis

The y axis shows us the Performance Index of the chosen dimension.

x axis

Share of Impressions analysed in & for the chosen dimension. This is the % share for your chosen split from the total data driven impressions.

Performance Overview
Dimension based Scatter Graph

4. Usage Benchmark Bar Graph

The Usage Benchmark Bar Graph has two axis and shows:

y axis

Share of media spend in % for the chosen selection on the y axis.

X axis

On the x axis the Benchmark Bar Graph show us the overall usage compared to the selected Industries/Advertisers split by the chosen dimension.

Usage Benchmark
Usage Benchmark Bar Graph

Media Type Filter

Media Type Filter
Media Type Filter

Term

Definitions

Audio

When a creative is delivered over an audio channel such as digital radio.

Display

Where the creative delivered was a Display creative, normally, html5, jpeg or gif formats.

Video

Where the creative delivered was a video creative, normally, per-roll, mid-roll, post-roll or out of stream.

KPI Filter

KPI Filter
KPI Filter

Term

Definitions

CPC

Cost Per Click, CPC is calculated by dividing the advertising spend by the number of clicks achieved.

This filter narrows the view to campaigns which have a CPC goal. The CPC Goal is used in the Performance Index as the basis for benchmarking.

CPM

Cost Per (Thousand) Impressions, CPM is calculated by dividing the advertising spend by the number of Impressions/1000 achieved.

This filter narrows the view to campaigns which have a CPM goal. The CPM Goal is used in the Performance Index as the basis for benchmarking.

CPV

Cost Per View CPM is calculated by dividing the advertising spend by the number of Viewed Impressions/1000 achieved.

This filter narrows the view to campaigns which have a CPV goal. The CPC Goal is used in the Performance Index as the basis for benchmarking.

Other (KPI)

KPIs which do not fall under CPC, CPM, CPV are grouped at Other.

Device Type Filter

Device Type Filter
Device Type Filter

Term

Definitions

Connected Device

When a creative is delivered over a Connected Device such has a Smart Watch.

Connected TV

When a creative is delivered over a Connected TV.

Desktop

When a creative is delivered over a Desktop Environment.

Other

Inventory not defined in an existing category.

DigitalOutOfHome

Creative delivered to Digital Out of Home Channels.

Smart Phone

When a creative is delivered over a Smart Phone Environment.

Tablet

When a creative is delivered over a Tablet.

Identifier Filter

Identifier Type
Identifier Type Filter
Term Definitions
Contextual: A contextual signal such as Page categorisation or KW targeting is utilised.
Geo Signal: A geo signal for either PLZ or Latitude and Longitude is utilised
Mixed: Where more than one identifier is in use and a single identifier can not be identified.
Standard Identifier: A cookie, Maid or ID is utilised